The enormous data collected over the years during college admissions is a goldmine that can be harnessed to develop a powerhouse that fuels the admission process by developing a well-performing admission strategy for colleges. This necessitates organizing the collected data, enabling a comprehensive analysis of its efficacy over the years, which requires conducting a Year-Over-Year comparison of the available data.
Having looked at various metrics within Eduleap that enhance college admission strategies, this second part of the blog explores the significance, purpose, and methodology behind comparing the yearly analytics for admissions.
What is Year-Over-Year (YoY) Comparison in Admission Software Analytics?
Comparing the Year-Over-Year analytics on an Online Admission Portal involves analyzing the admission metrics spanning several years to engage in data-driven decision-making. The wealth of information accumulated during student admissions throughout the years is presented in a meaningful and comprehensible format, shedding light on the effectiveness of their admission strategy for the current academic year. Ultimately, this comparative analysis yields insightful observations into the admission process.
What charts are accessible for Year-Over-Year comparisons on an online admission portal?
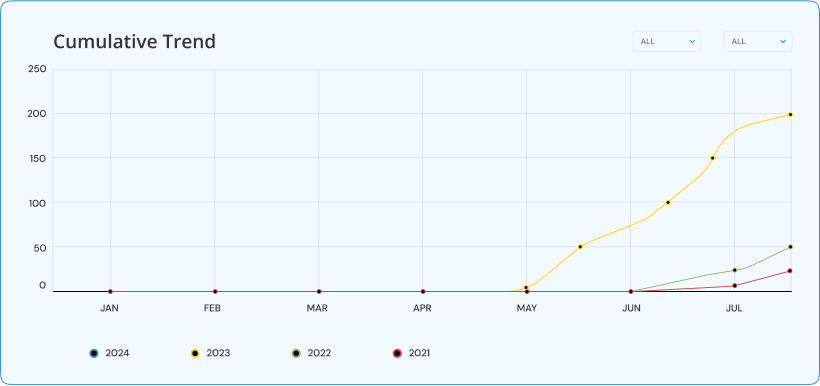

This chart projects the overall annual admission patterns at each stage of the admission process, starting with enrollment. This allows one to observe and comprehend the variation in admission rates over time. This information can help refine the admission initiation timing, allowing for strategic adjustments based on the observed growth or decline in admissions.

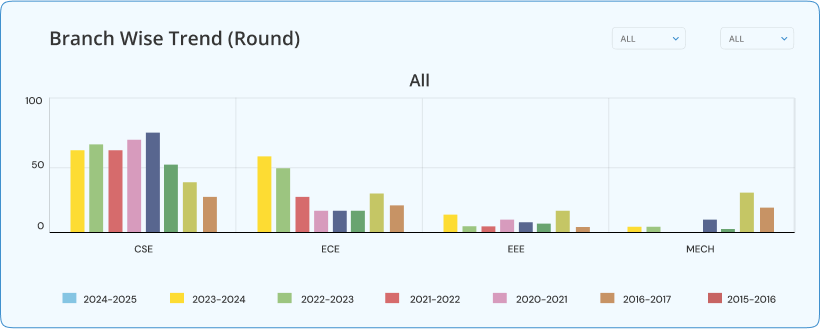
The Branch-wise trend assesses course demand over the years. This chart illustrates the fluctuation in students per course/stream. This allows for a convenient examination of student distribution across various courses, offering insights into the dynamic demand patterns for each course.

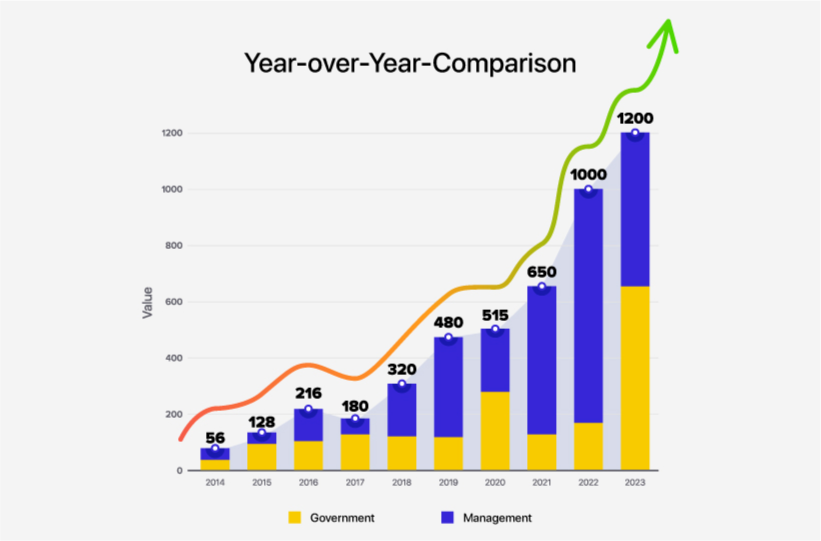
This chart contrasts student enrollment between government and management quotas. It enables colleges to discern the prevalence of admissions, the characteristics of candidates for a given academic year, and more.

This chart empowers administrators to effortlessly track the real-time admission status for various courses and streams on the current date, facilitating streamlined monitoring and efficient decision-making.

This graph illustrates student enrollment based on location, say by district, state, or any specific geographical category. This represents the student intake based on location, revealing the institution’s popularity across diverse areas and its appeal to varied demographics.

This chart projects the students in various stages of the admission process—enquiry, registration, and admission. This way, it is easy to view the ratio of students moving through the different stages of admission.

A few other charts that enable YoY comparison are Sibling distribution, student distribution by gender, community-wise distribution, etc., These charts enable the administrators to analyze and understand from various other perspectives, thereby helping them enhance the strategy.
What are the Benefits of Performing a YoY comparison on the Admission Metrics?
- Deciding on Registration Timelines: Examining the overall trend enables admission organizers to grasp the patterns of students engaging with their institution for admissions. Monitoring the spike and drop in registrations empowers them to refine admission strategies, adjusting advertising and registration timelines accordingly.
- Course Demand Analysis: The branch-wise trend analysis enhances understanding of changing demands by analyzing the fluctuation in the number of students across courses. This aids in strategic seat allocation and decisions regarding course additions or removals each academic year, fostering informed decision-making for resource allocation and curriculum planning.
- Analyzing Admission by Modes: The representation of admission mode variation – as in students in government vs. management quota helps educational institutions elevate their standards by strategically boosting the enrollment of inherently high-achieving candidates. This process involves identifying and attracting students with exceptional academic prowess, fostering an environment that challenges and motivates these individuals and positively influences the educational atmosphere.
- Align Marketing Strategies: Examining the district-wise breakdown of student intake supports targeted marketing endeavors, enabling a strategic approach to bolster enrollment in specific regions through tailored outreach and promotional activities.
- Optimize Admission Processes: Scrutinizing the different phases in admissions helps identify bottlenecks, streamline procedures, and enhance efficiency. This data-driven approach empowers administrators to optimize processes, allocate resources effectively, and ensure a seamless experience for students and the institution.
Developing and implementing an effective admission strategy is crucial for higher education institutions to achieve optimal outcomes. The analysis of diverse metrics and the annual analytics comparison complement each other, elevating your institution’s overall standards and performance. Strategize efficiently, reduce resource and time expenditures, and enhance results by delving into historical data.
Curious to witness a demo of our product? Require consultation on online admission processes? Connect with us, and we will engage with you on this!